Music therapy – Analysis
Summary
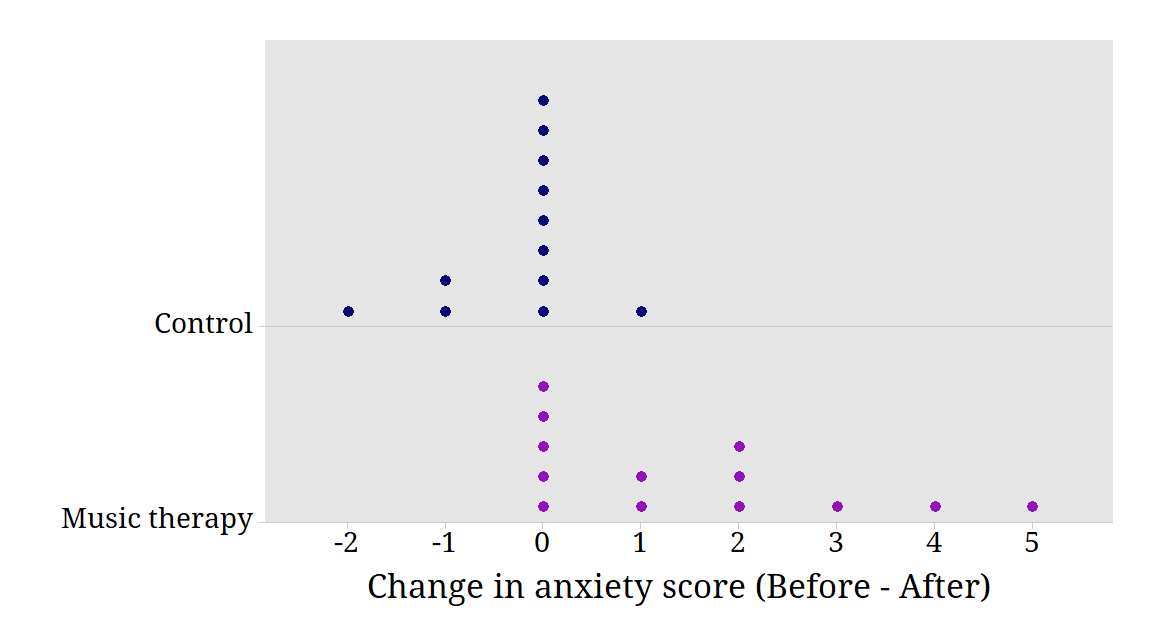
Thirty patients were recruited for the study, but only 12 control patients and 13 music therapy patients participated. Five patients either died or were discharged before the intervention was completed. The primary outcome was the change in ESAS anxiety rating from before to after treatment. The figure below shows these change scores for each group; since a higher ESAS score indicates higher anxiety, and the change has been calculated as (before minus after), a positive change reflects an improvement.
The reduction in ESAS anxiety on the VAS was, on average, 1.8 cm more for the music therapy group than for the control group. As the sample sizes are small and the distribution of the data is unlikely to be well approximated by the normal distribution, a bootstrap method was used to find a 95% confidence interval for the mean difference between the groups in the change in ESAS anxiety score; this was (0.9, 2.8).
Questions to consider
- Consider each group in the study separately. Work out some relevant statistical summaries in each group.
- When planning the study, an assumption was made about the strength of the correlation between measurements of anxiety on two occasions. Illustrate how the power of the study would change if the correlation was stronger than was assumed.
- Investigate the actual correlation between measurements of anxiety before and after the intervention irrespective of group. How does the result compare with the assumption made for the power analysis?
- On the analysis page a 95% confidence interval for the mean difference between the groups in the change in ESAS anxiety score was reported: (0.9, 2.8). It was calculated using bootstrap methods. How does this compare with the result from a standard method of calculating the confidence interval?
- Investigate the correlation between measurements of anxiety before and after the intervention for each group. Produce a visual display showing the relationship between the two measurements separately for each group. What does the visual display suggest about the relationship in each group? (Jittering may be useful on your display.)
- Consider predicting post-intervention anxiety from pre-intervention anxiety in each group. Obtain the regression equations, and interpret the slope and intercept in each case. What differences between the interventions does this suggest?
- Consider the ECOG performance status measured on each patient. The randomisation procedure should ensure that both groups are similar in terms of ECOG performance status. Investigate the distribution of this measure in the two groups; use visual displays and summary statistics.
- Compare the effects of the interventions on several outcomes including pain and shortness-of-breath. Consider appropriate methods of statistical inference for comparing the interventions. Present and summarise the findings using visual displays, and summary statistics.
- Examine the change in heart rate for each group. Examine the distribution of these data and suggest an appropriate method for comparing the effects of the interventions. Carry out an analysis to compare the effects of the interventions on heart rate.
- On examining the change in heart rate in the music therapy group, a colleague notices one patient’s heart rate increased by 47 beats per minute. He suggests to you that this patient should be excluded from the study. What do you say?
- Why was it important that someone other than Anne recruited participants to her study?
- The study was described to patients as assessing the effects of music therapy and volunteer and other services in the hospital on people’s symptoms. Why wasn’t Anne more explicit in describing the treatment and outcome she was interested in?
- Imagine that you are asked to present the key findings of Anne’s study to staff at the hospital who have little knowledge of statistics. Write a brief summary of the key findings explaining any statistical terms that you use. Include some visual displays that highlight the main outcome.
- Anne was aiming for a total of 60 subjects, but ultimately only recruited a total of 30. Data were obtained from 25 of the 30 patients recruited. Was this a problem?