Preventing falls – Study Design
Variables
- Baseline background measures
- Baseline risk factors
- Quadriceps strength (left and right)
- Postural sway in bare feet
- Postural sway on foam mat
- Maximal balance range
- Number of errors on dynamic balance test
- Timed-up-and-go test (time to complete test)
- Single leg balance (left and right)
- Low contrast acuity (left and right eye)
- High contrast acuity (left and right eye)
- Presence of stereopsis
- Field of view
- Total number of home hazards
- Height (cms)
- Weight (kg)
- Interventions
- Outcome measures
- Follow up measures
- Activities of daily living
- Use of support services
- Falls efficacy scale
- Number of medications taken
- General practitioner visits
- Hospital admissions
- Quadriceps strength (left and right)
- Postural sway in bare feet
- Postural sway on foam mat
- Maximal balance range
- Number of errors on dynamic balance test
- Timed-up-and-go test (time to complete test)
- Single leg balance (left and right)
- Low contrast acuity (left and right eye)
- High contrast acuity (left and right eye)
- Presence of stereopsis
- Field of view
- Total number of home hazards
Statistician’s description of the design
The study was a randomised controlled trial that examined the effectiveness of three interventions in reducing falls among the elderly. It was a full factorial design with three factors – exercise, vision improvement and home hazard reduction – each with two levels. Hence the trial included 8 independent groups. Computer software was used to assign each participant randomly to one of the eight groups.
Calculating the sample size for the study
An estimate of the sample size needed was calculated in the following way:
- The annual rate of falls if there was no intervention was assumed to be 35 falls / 100 people. This figure was based on recent data.
- It was assumed that any one intervention alone would reduce the rate of falls by 25%. Therefore, for the intervention group, the rate of falls would be 26 falls / 100 people.
- It was assumed that there is interest in detecting both positive and negative changes in the intervention group. Sample size calculations were based on a two-sided test.
- The significance level was set at 5%.
- The power – the probability of detecting a true difference between the control and intervention group – was set at 0.80.
- Using the assumptions above, 914 participants were required.
- It was assumed that 20% of those who initially agreed to participate would drop out.
- Hence the final sample size required is 1143, since 914 = 80% of 1143.
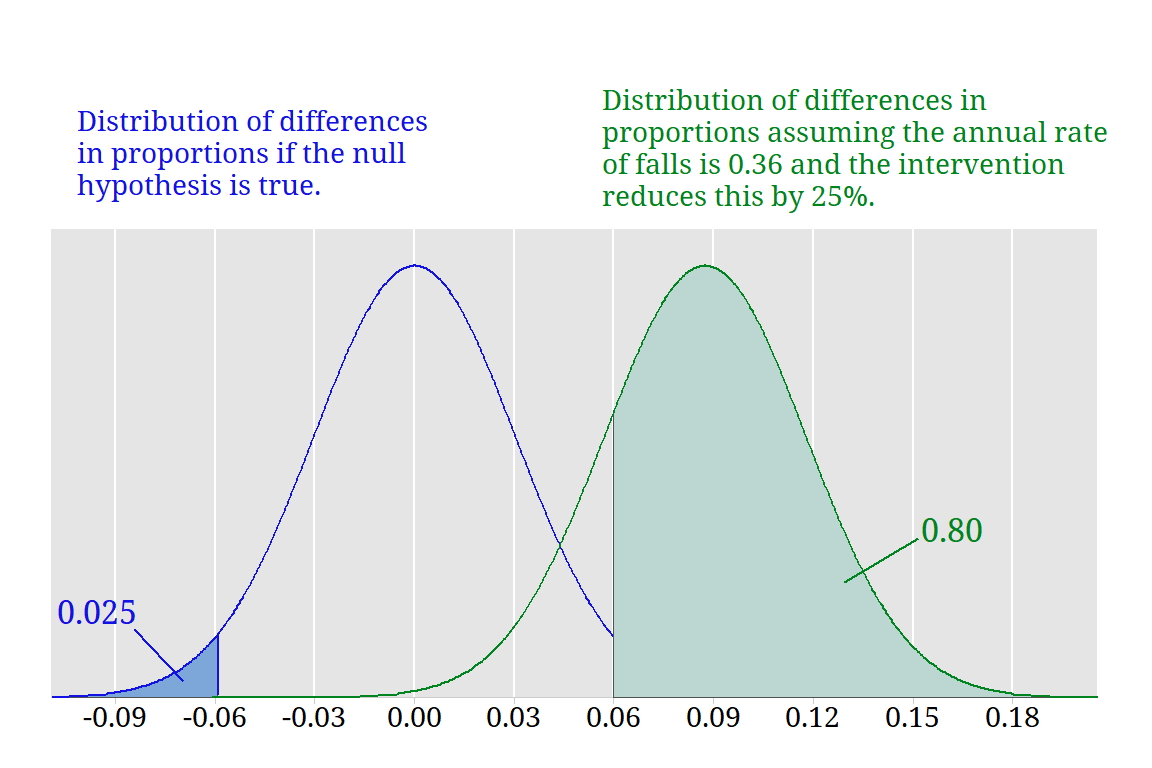
The figure shows sampling distributions of the difference in proportions between the control and intervention group with equal sample sizes of 457. The blue distribution is the sampling distribution when the true proportions in the experimental and control groups are equal. The green distribution is the sampling distribution of differences in proportion when the intervention reduces the annual rate by 25%.
Randomisation procedure
As participants were recruited into the study, they were randomly assigned to one of the eight treatment groups. Hence entry to the study was “staggered” and there was potential for imbalance in the number of participants assigned to the eight groups. This is particularly a problem if the numbers of participants are small.
The randomisation procedure used attempted to adjust for this potential imbalance. The computer software used produced randomisation charts following an adaptive biased coin procedure. The adaptive biased coin procedure adjusts the probability of assignment to group i at any given time according to the degree of imbalance in the current group assignments, giving slightly higher probabilities of allocation to groups with disproportionately low numbers.
Sample Randomisation Chart
| Number of treatment groups | 8 | |
|---|---|---|
| Total number of subjects | 60 | |
| This chart commenced at subject number | 46 | |
| Treatment | Previous tally | Cumulative tally in this chart |
| Control | 5 | 7 |
| Home modification | 6 | 8 |
| Exercise | 5 | 7 |
| Vision | 5 | 7 |
| Home modifications & Exercise | 6 | 7 |
| Home modifications & Vision | 6 | 8 |
| Exercise & Vision | 6 | 7 |
| Home modifications, Exercise & Vision | 6 | 9 |
Some references on the randomisation procedure:
Lachin, J.M. (1988) Statistical properties of randomization in clinical trials. Controlled Clinical Trials, 9, 289-311.
Wei, L.J. (1978) The adaptive biased-coin design for sequential experiments. Annals of Statistics, 6, 92-100.
Wei, L.J. & Lachin, J.M. (1988) Properties of urn randomization in clinical trials. Controlled Clinical Trials, 9, 345-364.
Ethics
Click the play button to hear Lesley Day’s response. |
Click the play button to hear Lesley Day’s response.
“Were there any ethical issues in designing and conducting the study?”